Debugging is like being a detective in a crime movie where you are both the investigator and the criminal. You’ve written the code, and now you have to find out what’s wrong with it.
In software development, debugging is a critical skill that every developer must master.
This article aims to provide you with a deep dive into debugging techniques, tools, and strategies that can help you navigate through complex codebases.
Understanding the debugging process: a step-by-step guide
Debugging is a critical part of the software development process and is a skill every developer needs to master.
Understanding the step-by-step debugging process equips you with a structured approach, making it easier to effectively use debugging strategies and tools later on.
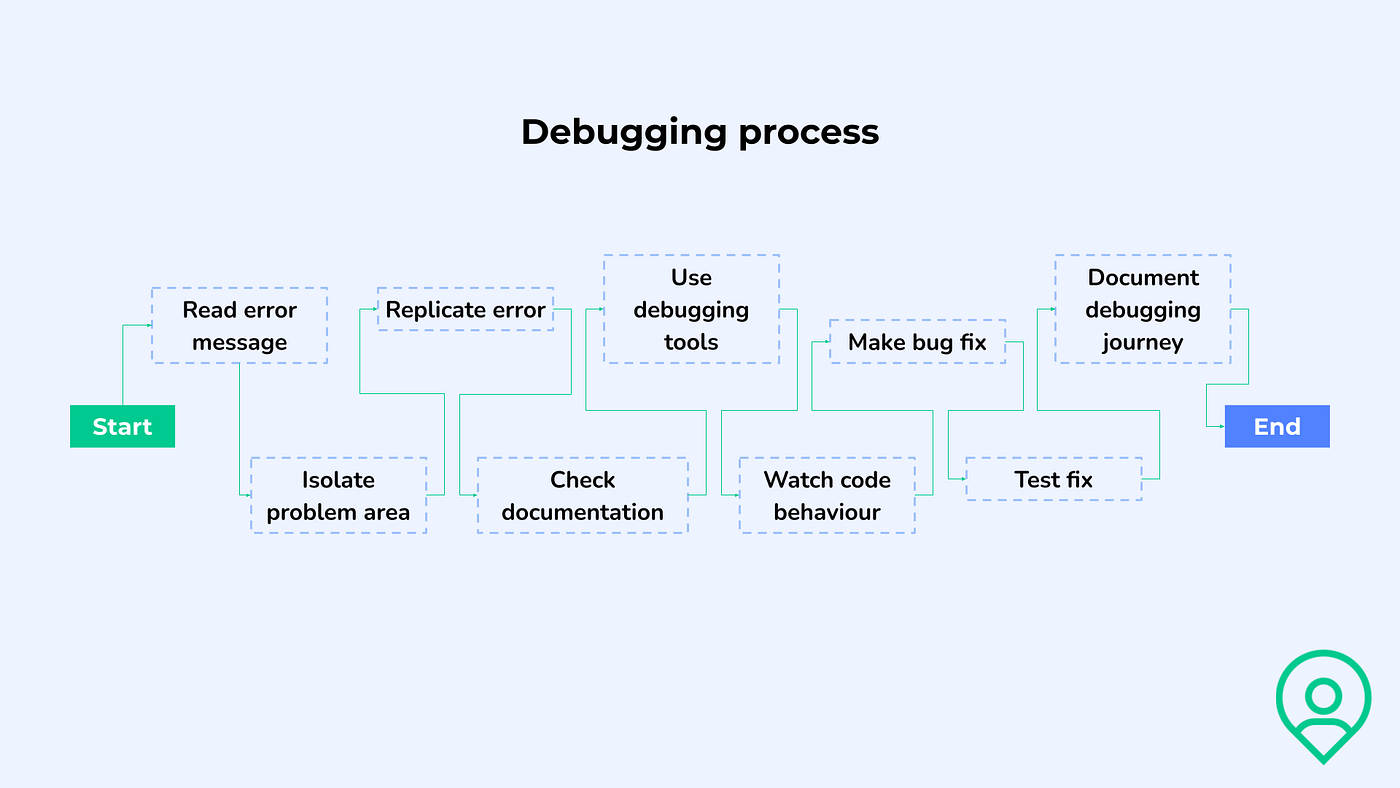
1. Reading the error message
Start with the error message. It’s like your first clue in a mystery. Error messages often point you to where the error occurs in your source code. This is your starting point for identifying bugs.
2. Isolating the problem area
Next, narrow down where the issue might be in your code. You can use print debugging here. Add print statements to track the program execution and see where things go off course.
3. Running the code to replicate the error
Run the isolated part of the code again. Make sure the error wasn’t a one-time thing. Consistently replicating the error confirms you’re looking in the right place.
4. Checking the documentation
Take a moment to look at any relevant documentation. Sometimes the issue is a simple misunderstanding of how a function or library works.
5. Using debugging tools for deeper insight
Now, bring in the debugging tools. Whether it’s an integrated development environment (IDE) or open-source debugging tools, these are your best friends for a deep dive. If the error occurs on a different machine, remote debugging is your go-to strategy.
6. Watching code behavior while stepping through
Pay close attention while stepping through the code.
Look at variables, check the flow, and see how different parts interact.
This is where you catch logic errors, which are often the trickiest to spot. You can also use static analysis tools to spot coding errors without running the code.
7. Making the bug fix
Found the bug? Great, now fix it. This could be as simple as fixing a syntax error or as complex as rewriting a piece of your software program.
8. Testing to confirm the fix
Don’t celebrate just yet. Run your code through the testing process to make sure your fix didn’t break anything else. Testing debugging is crucial here.
9. Documenting your debugging journey
Last but not least, write down what you did. This helps you and other software developers in the future. Document the error message, how you isolated the issue, and what steps you took for the bug fix.
Debugging techniques and strategies
Debugging is an essential skill in software development. The right techniques can save you hours of time and frustration. Let’s get into the specifics of some tried-and-true debugging methods that professionals rely on.
Print debugging: The first line of defense
Print debugging is often the first strategy software developers turn to. It involves inserting print statements into your code to monitor program execution. These statements can reveal the values of variables, the sequence of function calls, or even the point where an error occurs.
Why it’s useful:
- Quick to implement
- Doesn’t require specialized debugging tools
- Effective for isolating the section of code where a particular bug may be hiding
When to use it:
- During the initial stages of debugging
- When dealing with simple applications
- When you need immediate feedback on program execution
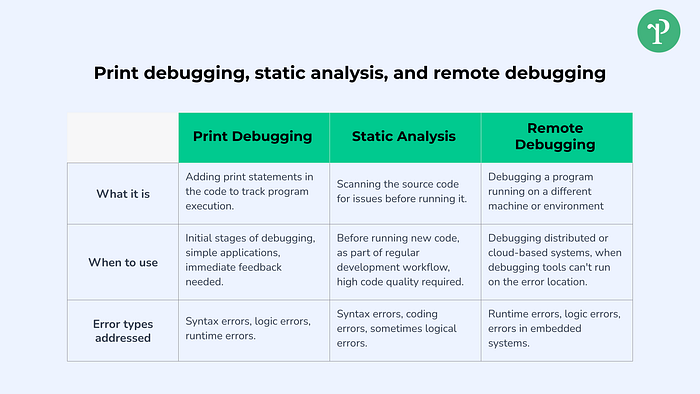
Static analysis: The proactive approach
Static analysis is a debugging technique that scans your source code for issues before the testing process even begins. It can identify a range of problems, from syntax errors to more complex coding errors.
Why it’s useful:
- Catches issues early in the software development process
- Helps maintain code quality
- Many integrated development environments (IDEs) offer built-in static analysis tools
When to use it:
- Before running new code for the first time
- As part of your regular development workflow
- When you’re working on projects that require high code quality, such as financial or healthcare software
Remote debugging: The specialized tool for complex systems
Remote debugging is a more advanced technique that allows software developers to debug a program running on a different machine, often in a different geographical location. This is especially useful for cloud-based applications, embedded systems, and other complex software programs.
Why it’s useful:
- Enables debugging of distributed systems
- Allows for real-time collaboration among developers
- Essential for debugging software that runs in specialized environments that are not easily accessible
When to use it:
- When dealing with distributed or cloud-based systems
- When the debugging tool can’t run on the machine where the error occurs
- When you need to collaborate with other developers to fix a bug
Understanding these debugging techniques and knowing when to apply them can significantly improve your efficiency in identifying and fixing bugs. Each method has its own set of advantages and is best suited for specific challenges in the software development lifecycle.
Popular debugging tools
The tools you choose can make or break your workflow. Let’s dive into the different types of debugging tools available, and how each can offer unique advantages in your software development process.
Open source debugging tools
When it comes to debugging, open-source tools like GDB for C/C++ and PDB for Python offer a lot of flexibility.
What makes these tools stand out is the strong community support. You can ask questions, share solutions, and even contribute to the tool’s development.
Integrated development environment (IDE)
If you’re using an IDE, you’ve got a treasure trove of debugging features at your fingertips.
For instance, you can set breakpoints to pause your code at specific lines, allowing you to inspect variables, memory state, and the call stack. This is invaluable for tracking down where exactly things start to go awry.
Some IDEs even offer “time-travel” debugging, letting you step forwards and backwards through code execution to pinpoint errors. It’s like having a rewind button for your code.
Specialized debugging tools
Beyond the general-purpose tools, there are specialized debugging tools tailored for specific needs. Take Valgrind, for example. It’s a tool specifically designed to find memory leaks and undefined memory use.
If you’re working on a large-scale application where performance is key, using specialized tools can save you a lot of headaches down the line.
Debugging tools for web development
For web developers, browser-based tools like Chrome DevTools or Firefox Developer Tools are indispensable. These tools allow you to inspect HTML, CSS, and JavaScript in real-time.
You can even simulate different devices and internet speeds. This is crucial for ensuring that your website or web app provides a consistent user experience across all platforms.
Debugging embedded systems
If you’re working on embedded systems, you might need hardware debugging tools.
These tools interact directly with the hardware your code is running on, offering insights that software-based tools can’t provide.
They can be particularly useful for debugging real-time systems where timing is a critical factor.
Scripting languages and lightweight tools
For scripting languages like JavaScript, Python, or Ruby, lightweight debugging tools can often be the best choice. These tools are designed for quick, iterative debugging cycles. They might not have all the bells and whistles of a full-fledged IDE, but they’re fast, easy to use, and perfect for scripting tasks.
The right tool for the job
Choosing the right debugging tool often depends on the specific challenges you’re facing.
Whether you’re dealing with a complex multi-threaded application, a simple script, or an embedded system, there’s likely a tool out there tailored for your needs.
The key is to understand what each tool offers and how it can solve your specific problems.
Let’s get into the nitty-gritty of the types of errors you’ll often encounter in software development. Understanding how to identify and fix these errors is crucial in the debugging process. It’s not just about seeing an error message; it’s about knowing what to do next.
Common types of errors and how to tackle them
Let’s get into the nitty-gritty of the types of errors you’ll often encounter in software development. Understanding how to identify and fix these errors is crucial in the debugging process.
Syntax errors
Syntax errors are like the spelling mistakes of the coding world. They usually show up when you’re writing your code and are often flagged by integrated development environments (IDEs) in real-time. These errors can include missing semicolons, unmatched brackets, or incorrect function calls.
Pro tip: Use static analysis tools. These software tools scan your source code for potential syntax errors and other coding errors, helping you catch them before the testing process even begins.
Logic errors
Logic errors are the most elusive. Your program runs, but the output isn’t what you expected. These are the bugs that slip through the testing debugging phase because they don’t crash your program or produce error messages. To tackle logic errors:
- Break down the code: Isolate the section where you think the logic error exists. Run unit tests to validate each part.
- Step-by-step debugging: Use debugging tools to step through the code line by line during program execution. This can help you identify bugs in the logic.
- Question assumptions: Sometimes logic errors occur because of incorrect assumptions about how a particular software program or function works. Always double-check your assumptions.
Pro tip: Watch out for edge cases and boundary conditions. These are often the culprits behind logic errors.
Runtime errors
Runtime errors happen during program execution and are usually flagged by error messages. These can be caused by a variety of issues like dividing by zero, null pointer references, or even external factors like a missing file.
- Read the error messages: They usually contain valuable clues about what went wrong and where the error occurs.
- Use debugging tools: Debugging tools can pause program execution at the point where the error occurs, allowing you to inspect variables, memory state, and other aspects.
- Check external dependencies: Sometimes, runtime errors are caused by external issues like a network outage or missing files. Make sure all external elements are in place.
Pro tip: Use exception handling mechanisms in your programming languages to catch and manage runtime errors. This way, even if an error occurs, your entire software development process won’t come to a halt.

Testing and debugging: Two sides of the same coin
Testing and debugging are your left and right hand in the software development process. While automated tests help you identify bugs, debugging is your strategy for fixing bugs. Automated tests can be particularly useful for catching syntax errors and runtime errors before they become a bigger issue. Once a particular bug is identified through testing, debugging tools become your best friend for fixing it.
Pro tip: Make debugging and testing an integral part of your entire software development lifecycle. Don’t treat them as separate entities; they are interconnected stages that help you maintain a healthy codebase.
Conclusion
Debugging is an art as much as it is a skill. It involves a variety of techniques, tools, and a lot of patience.
Whether you’re dealing with syntax errors, logic errors, or runtime errors, understanding the debugging process and having a strategy can make your life much easier.
So the next time you see an error message, take a deep breath, roll up your sleeves, and dive into the code.
Happy debugging!